Skills Required for Business Analyst Freshers in 2026: The 5 Core Skills
A business analyst fresher needs five core skills: Excel, SQL, a dashboard tool such as Power BI, Jira, and clear written documentation. Learn them in that order and prove each with one small project to stand out in the 2026 job market.

Say you have sent sixty applications for business analyst roles. Your resume lists Excel, SQL, Power BI and Jira. Nobody has called back. What are they missing?
A business analyst fresher needs five core skills: Excel, SQL, a dashboard tool such as Power BI, Jira, and clear written documentation. Learn them in that order, and prove each with one small project. Fresher BA salaries in India run about ₹3.5–7 LPA, according to Jobaaj Learnings.
Skills required for a business analyst role: what recruiters check
Skill guides for this role, such as the Fateh Education skills guide, generally pair tools (Excel, SQL, Power BI, Jira) with business skills (talking to stakeholders, writing requirements, thinking about data).
The business skills are what make this job different from a data analyst's. The Jobaaj Learnings roadmap draws the line like this: a BA works with stakeholders and business problems, while a data analyst works mainly with datasets.
| Business analyst | Data analyst | |
|---|---|---|
| Works mainly with | Stakeholders and business problems | Datasets |
| Typical output | Requirements and user stories | Reports and dashboards |
| Main question | "What should we build or change?" | "What does the data say?" |
Pay grows as those business skills grow. Past the fresher band, the same page puts BAs with 2–5 years of experience at ₹7–15 LPA, and senior BAs at ₹15 LPA and above.
Every skill below also gets a resume line later, in the resume section.
Start with Excel: clean data and build pivot tables
Excel is the first stage because every business team already uses it, and it teaches you to clean messy data before you analyse it. The Jobaaj roadmap names the parts that matter: pivot tables, lookups, data cleaning and Power Query.
Cleaning comes before everything else. Real files have blank rows, dates stored as text and the same city spelled three ways. Power Query records each cleaning step, so you can run it again on next month's file in one click. Lookups (XLOOKUP or VLOOKUP) join two sheets, such as orders and customers. Pivot tables then summarise thousands of rows into a small grid.
You do not need to buy anything. Excel on the web is free with a Microsoft account, and Google Sheets has pivot tables too. Power Query needs desktop Excel, which many college labs already have.
Project that proves it: download a public sales or orders file, clean it, and build one pivot table. Under it, write three findings in plain sentences, such as "Weekend orders are smaller but more frequent."
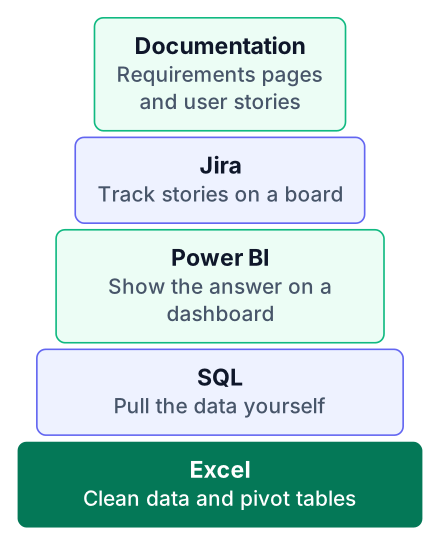
Here is the full staged path, with one project per stage. It works like the week-by-week front-end plan: finish one stage before starting the next.
Excel
Clean an orders file and summarise it in one pivot table.
SQL
Answer ten business questions with ten saved queries.
Dashboard
Build a one-page Power BI report from the same data.
Jira
Turn one business problem into a small board of user stories.
Documentation
Write one requirements page that a developer could build from.
Learn SQL to pull the data yourself
SQL lets you answer a business question from a database without waiting for someone else to export a file. The Jobaaj list is a short one: SELECT, WHERE, JOIN, GROUP BY, aggregates such as COUNT and SUM, and subqueries.
That is a smaller set than a data engineer needs. Compare it with the data engineer fresher skill list, where SQL is only the starting point. A BA rarely tunes queries for speed. You write them to get a correct answer, then explain it.
Pick one free database. SQLite needs no server and runs from a single file. MySQL Community and PostgreSQL are both free and closer to what Indian IT companies use. Load a sample orders dataset into any of them.
Project that proves it: ten saved queries on one dataset. Above each query, write the business question in one line, such as "-- Which city has the most cancelled orders?" A recruiter reads the questions first.
Turn one business problem into SQL, a user story and acceptance criteria
This is the bridge a BA is hired for: one e-commerce checkout drop-off problem becomes a query, a user story, acceptance criteria and a chart. The manager's request is a single sentence: "Too many shoppers leave at checkout."
First, find where they leave. Checkout has four steps: cart, address, payment and order placed. This query counts sessions at each step and shows how many were lost since the step before.
-- Business question: at which checkout step do shoppers leave?
WITH step_counts AS (
  SELECT step,
         step_order,
         COUNT(DISTINCT session_id) AS sessions
  FROM checkout_events
  GROUP BY step, step_order
)
SELECT step,
       sessions,
       LAG(sessions) OVER (ORDER BY step_order) - sessions AS lost_since_previous_step
FROM step_counts
ORDER BY step_order;
LAG reads the value from the row above, which is how you get the drop between steps. If window functions are new to you, the window functions guide walks through LAG slowly.
Now some made-up practice data, not real figures. Say the checkout_events table has the columns session_id, step and step_order, with one row each time a session reaches a step. Running the query on that practice data returns four rows. The first step has no step before it, so LAG gives NULL there.
| step | sessions | lost_since_previous_step |
|---|---|---|
| cart | 1000 | NULL |
| address | 820 | 180 |
| payment | 610 | 210 |
| order placed | 300 | 310 |
The biggest drop, 310 sessions, sits on the order-placed row: shoppers reached payment but did not finish paying. That finding becomes a requirement.
User story: As a shopper, I want to pay with UPI on the payment page, so that I can finish my order without typing card details.
Acceptance criteria:
- Given I am on the payment page, when it loads, then UPI appears as a payment option.
- Given I choose UPI, when I enter a valid UPI ID, then the app sends a payment request to my UPI app.
- Given the payment succeeds, when the app confirms it, then I see the order-placed page.
- Given the payment fails, when I return to the site, then my cart is still there and I can try again.
The last piece is a picture of the same numbers: an Excel pivot chart, or a Power BI funnel visual with one bar per step. A manager sees the narrow bar at payment in seconds.
| Artefact | Who reads it | What they do with it |
|---|---|---|
| SQL query | You, and other analysts | Check the numbers behind the decision |
| User story | Developer | Understand what to build and why |
| Acceptance criteria | Tester | Write test cases that pass or fail |
| Funnel chart | Manager | Approve the fix and its priority |
Build a Power BI dashboard from the same data
A dashboard shows managers the answer at a glance, so one clean page with a clear title beats five crowded pages. The Jobaaj roadmap names Power BI and Tableau as the two tools freshers should pick from.
Power BI Desktop is free and runs on Windows. On a Mac, use Tableau Public, which is also free. Import the checkout query results from the last section. Then build three things: a funnel chart, a card showing the drop-off percentage at payment, and one filter for device type.
Give the page a title that states the finding, like "Most shoppers leave at payment." A title like "Checkout Dashboard" makes the manager work out the answer alone.
Project that proves it: publish the one-page dashboard as a screenshot or public link. Add a three-sentence summary of what the manager should do next.
Practise Jira and Confluence-style documentation
Jira and written documents are where a BA's work becomes visible to developers and testers. The Simplilearn BA roadmap lists the skills behind them: requirements elicitation, use-case writing, BPMN process mapping and UAT support.
Each of those has a plain meaning. Elicitation means asking stakeholders questions until the real need is clear. BPMN is a standard way to draw a process as boxes and arrows. UAT (user acceptance testing) is when real users try the feature before release, and the BA helps them check it against the acceptance criteria.
The Jira free plan is enough to practise. Create a project and add one epic called "Reduce checkout drop-off." Write user stories under it, paste the acceptance criteria into each, and move cards from To Do to Done. For the requirements document, use Confluence's free plan or a Notion page. Include the problem, the data, a BPMN sketch of checkout and the stories.
Project that proves it: a Jira board with eight stories for the checkout fix, plus one requirements page linked from the epic.
Show your skills on a business analyst fresher resume
Put one line of proof under each skill, such as the question you answered and the result, instead of a bare list of tool names. Below, "Pros" describes a project-proof line, like "SQL: found the checkout step with the biggest drop-off in a practice dataset." "Cons" describes a tool-only line, like "SQL."
Pros
- Shows you can use the tool on a business question.
- Gives the interviewer something to ask about.
- Passes keyword filters, because the tool name is still there.
Cons
- Looks the same as hundreds of other resumes.
- Says nothing about your level.
- Gives the recruiter no reason to click a link.
Put your GitHub or dashboard link next to the project line itself, not only in the header. Recruiters click links that sit beside a claim.
Communication belongs on the resume too, but as proof. "Wrote a requirements page and eight user stories for a checkout fix" shows writing skill. "Good communication skills" shows nothing.
Common mistakes freshers make
Four mistakes slow freshers down: learning tools only, ignoring communication, skipping projects, and collecting certificates without practice. All four come from the Jobaaj fresher guide, and each has a simple fix.
- Learning tools only. Fix: start every practice session with a business question, then pick the tool.
- Ignoring communication. Fix: write a short plain-English summary under every query and chart you make.
- Skipping projects. Fix: finish the one project per stage before moving on.
- Collecting certificates without practice. Fix: for every course you finish, publish one piece of work that uses it.
This week, download one free orders dataset, write the question "Where do shoppers leave checkout?", answer it with one SQL query, and save it as your first portfolio project.


